
How many mystery shopping visits does a store need before its score means anything? More than most programs buy, and it depends on what you plan to do with the number. This guide works through mystery shopping sample size the way an analyst plans a year of waves: what one visit can tell you, how to size visits per location against the decision, a worked example for a 60-store chain, and how to spread visits across dayparts, shoppers and months. Every number below is an illustration, not an industry benchmark.
One visit is an anecdote
Take a yes/no question such as "Was the customer greeted within 30 seconds?" and suppose it scored yes in 10 of 12 visits across a region. The observed pass rate is 83%. How sure can you be about the real rate?
The standard error of a proportion is the square root of p(1-p)/n. With p = 0.83 and n = 12 that is the square root of 0.83 x 0.17 / 12, about 0.11, or 11 points. The usual two-standard-error band is therefore about 22 points either side of 83%. The more careful calculation for small samples (the Wilson score interval, which does not overshoot 100%) puts the band at roughly 55% to 95%. In plain words: twelve visits cannot tell a region that greets 6 customers in 10 from one that greets 19 in 20.
Now shrink that to one store. One visit gives a pass rate of 0% or 100%. Two visits give 0%, 50% or 100%. The overall score moves in smaller steps because it averages many questions, but every question underneath it is one of those coin flips. A store manager who says "the shopper caught a bad day" is often right. The answer is more visits.
There is no standard number of visits per outlet. The number comes from the band you can live with and the decision you are about to make.
Mystery shopping sample size: decide what the number has to support
Visits can go deep (more per location) or wide (more locations). Per-location decisions such as a coaching conversation, a bonus or a franchise compliance finding need depth: the store's own number has to be stable enough that the manager cannot explain it away. Network and regional trends need breadth: sixty stores visited once each give 60 observations per question, and the network average is solid even though every store number is noisy.
| Purpose of the number | Visits per location per wave | Note |
|---|---|---|
| Network or regional score for a quarterly review | 1 to 2 | Breadth does the work; the store figure is a hint, not a finding |
| Benchmark a store against its region | 2 to 3 | Read sections and questions, not the overall |
| Coaching conversation with a store manager | 3 to 4, or 1 per month accumulated over a quarter | Needs repeated failures on the same question before it is a pattern |
| Bonus, penalty or franchise compliance | 6 or more over the review period, spread across dayparts | One bad visit must never decide a pay-out |
The table is a planning aid, not a guarantee. The test for any row: what would you do differently if the true rate were 15 points lower?
The worked example: 60 stores, quarterly waves
A retail chain with 60 stores in four regions wants a quarterly network score, a regional comparison and a way to work on its weakest stores. The plan:
- Base program: four quarterly waves, two visits per store per wave. That is 120 audits per wave and 480 per year.
- Weak-store add-on: after the first wave, the ten lowest-scoring stores get one extra visit every month for the remaining nine months. That is 90 more audits.
- Total: 570 audits in the year.
Cost, at an example fee of 30 EUR per visit plus an average of 10 EUR for travel: 570 x 40 EUR = 22,800 EUR in shopper fees for the year, of which the add-on is 3,600 EUR. The point is the proportion, not the figure.
What each quarterly wave can say:
- Network: 120 observations per question. A pass rate of 83% carries a band of roughly 76% to 89%. Good enough to report a direction between waves if the move is larger than a few points.
- Region: 15 stores, 30 observations. The band is about twice as wide. Differences of ten points between regions are real; three points are not.
- Store: 2 observations. Enough to flag, not to conclude. Use it to pick the ten stores for the add-on.
By the end of the year the ten weak stores have 8 quarterly visits plus 9 monthly ones, 17 in all: enough to say which questions a store fails repeatedly and whether anything moved after a coaching conversation. In Shopper-X this is a quarterly wave for all stores and a monthly wave for the ten, with the questionnaire cloned into each. The schedule can clone a previous wave's objects and audits into the next one, so the monthly wave is set up once and copied.
Dayparts and rotation
Two visits per store are only two observations if they are different observations. Two Tuesday-morning visits by the same shopper tell you about Tuesday mornings and that shopper.
- Time range per audit. Every audit in the schedule carries a time range and an audit period. For two visits per wave, give one a weekday morning window and the other a weekend afternoon.
- Excluded dates per wave. Inventory days, public holidays and a promotion launch day do not represent a normal week. The schedule settings per wave hold an excluded-dates list.
- Shopper rotation. Never send the same shopper twice to one location within a wave, and avoid sending them back next wave if the staff could recognize them. The schedule row shows each shopper with their number of checks in the wave, so a planner sees who is overloaded before the assignment emails go out.
Rotation needs a panel. 120 audits per wave with no repeats at a location and three to five visits per shopper needs 25 to 40 active shoppers; if the panel is thinner, recruit first.
Add a wave or add visits?
When the budget allows one more unit of effort, put it into more waves if you want a trend. The "score dynamics per months / waves" chart on the statistics dashboard draws one bar per wave. Two bars are a comparison, four are the beginning of a trend, and a store manager looking at eight bars does not need the statistics explained.
Be careful with small moves. With two visits and a 30-question scenario, one changed yes/no answer moves a store's overall score by roughly one to three points. A store that goes from 81% to 84% between waves has, in most cases, changed one answer. Treat a swing of that size as noise at store level and read it only at region or network level.
Same budget, better data: monthly instead of quarterly
A chain that can afford three visits per store per quarter can instead afford one visit per store per month. Both plans give 12 visits per store per year and 720 audits for 60 stores. The fees are the same. The data is not.
The monthly plan gives twelve points on the dynamics chart instead of four, so a staffing change shows up in the month it happens. The shopper load is spread across the year, which makes rotation and dayparts easier to honor, and validation work arrives in a steady stream instead of a quarterly pile.
The trade-offs: monthly scheduling is more admin, and one visit per month per store is still one observation. Read store decisions on a rolling quarter (the last three visits) and keep monthly reads for the network and regions.
With few visits, read sections and problem questions, not the overall
An overall store score built from two visits is the least reliable number in the program. The questions underneath it are more useful. A question that fails at 40 of 60 stores is a process fact however few visits each store had, and a question that fails at one store in both visits of three consecutive waves is a store fact.
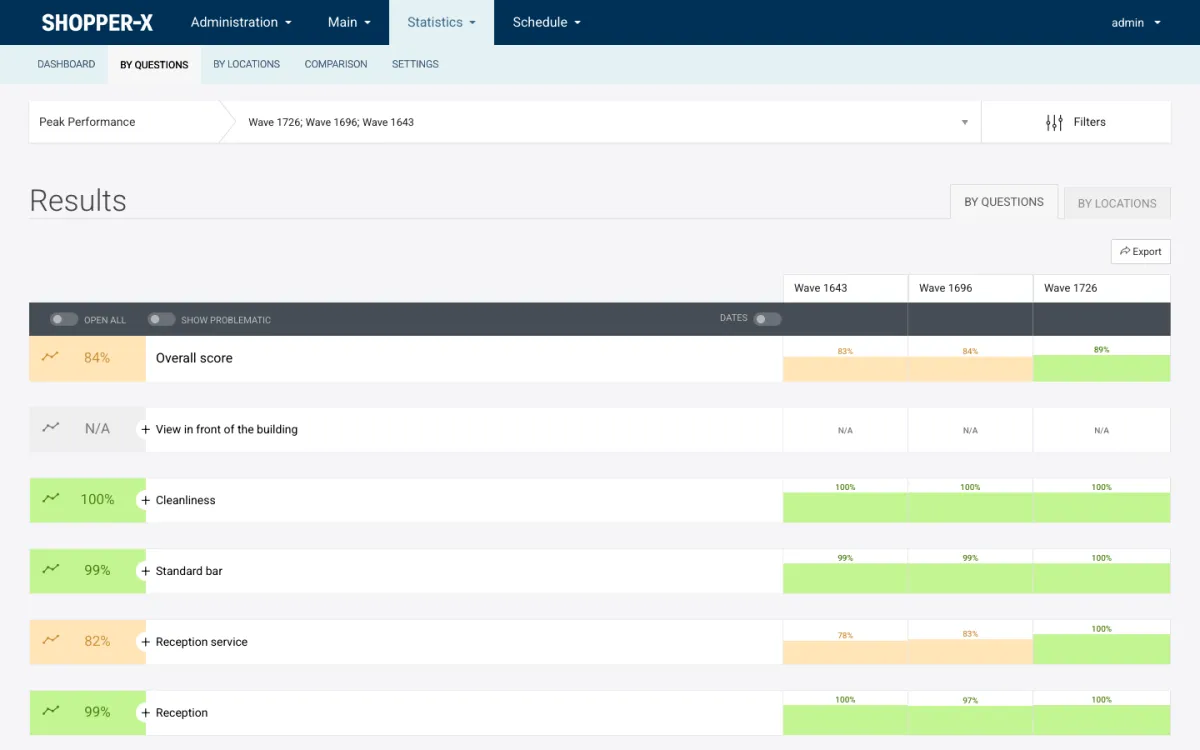
The "By questions" grid in Shopper-X lists sections with a percentage cell per wave, expanding to blocks and questions. The "show problematic" toggle hides every cell above the threshold you set, so a 48-question scenario collapses to the handful of questions that are failing. For a program with two visits per store, this grid filtered to one region is the page to open before a coaching call, not the dashboard ring. How to use mystery shopping results walks through that reading order, and mystery shopping KPIs explains how the section percentages are built from question weights.
Rules of thumb
These are planning habits, not standards. Each one has exceptions.
- Never make a per-store decision on fewer than three visits, or a pay decision on fewer than six.
- Two visits at a store should differ in daypart and shopper; otherwise count them as one.
- Add visits where the score is low or the stakes are high, not evenly. A weak-store add-on costs a fraction of the base program.
- Say the sample size in every report. "Store 14: 84% on 2 visits" is an honest number; "Store 14: 84%" is not.
FAQ
Is one visit per quarter per store enough?
For a network score across many stores, yes. For anything said about a single store, no. Four observations a year per store are enough to list the questions that failed repeatedly, not enough to defend a score to a manager who disagrees with it. If that is all the budget allows, report by region and by question.
How many locations do we need for a network score?
The network score depends on the total number of visits, not the number of locations. Sixty stores with one visit each and twenty stores with three visits each both give 60 observations per question; the first plan supports regional comparison, the second supports per-store reads.
Does the platform limit the number of visits per location?
No. In Shopper-X every audit is one shopper at one location with one questionnaire inside a wave, and you can add as many audits per location per wave as the plan needs, by adding empty audits, cloning an audit or importing the schedule from a spreadsheet.
Related reading
- Mystery shopping KPIs: what to measure and what the score means
- How to use mystery shopping results: from the score to a coaching conversation
- Scheduling: waves, audits, dayparts and shopper rotation
To size a program for your own network, request a demo and bring your store count and budget.