
Shopper-X is mystery shopping reporting software that lives in the same system as the schedule and the validation queue. When a validator accepts a report, its answers go straight into the statistics module and into the client's portal. Nothing is exported and re-imported between fieldwork and reporting. This page describes what the agency administrator sees, what the client sees, and how the data leaves the system when someone needs it elsewhere.
The statistics dashboard
The dashboard opens with three widgets. The first is the overall score drawn as a concentric ring chart, one ring per section of the questionnaire, each colored by its threshold band. The second is a region panel with a trend area chart. The third shows the overall score dynamics as bars per month or per wave, so a drop in one wave is visible before anyone opens a grid.
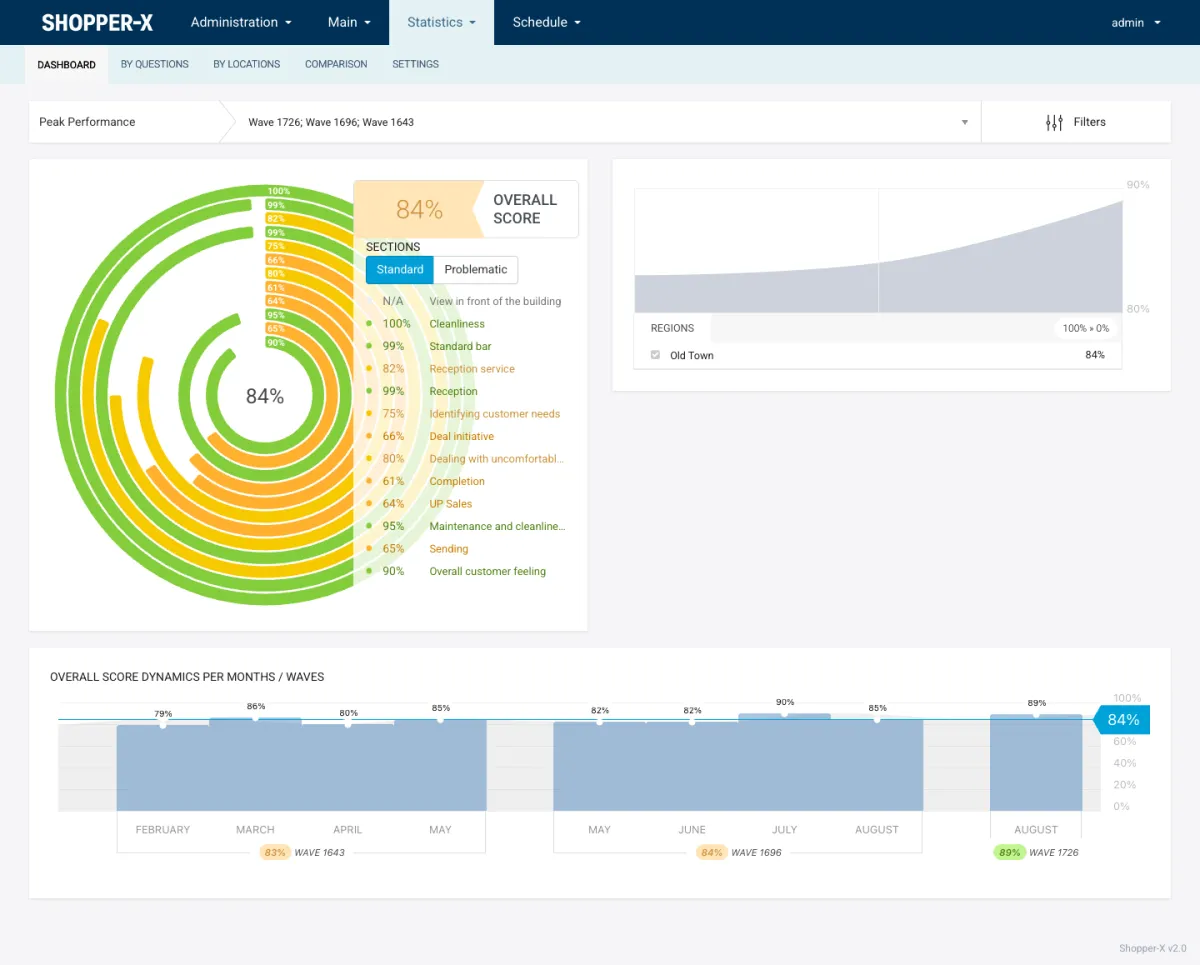
An administrator picks the customer first, then the waves. The screenshot shows the demo customer Peak Performance at 84% across three waves. A client who logs in gets the same three widgets, limited to its own data.
Four views
By questions
The grid lists the sections of the questionnaire. A section expands to its blocks and a block expands to its questions. Each column is one wave or one day, depending on the filter. The "show problematic" toggle keeps only the cells below the threshold on screen. "Open all" expands the whole tree at once.
By locations
The same scores grouped by region and then by location. Use this view when the question is "which stores" rather than "which part of the service".
Comparison
Objects, districts or zones side by side, one column each. The overall score sits at the top of the column and the per-section percentages below. Columns can be added and removed. The selection persists through the session, so a client who compares the same five stores every week does not rebuild the set each time. A list or chart toggle switches between the table and a chart of the same numbers.
Color thresholds saved per user
Every score is color-banded. The bands are thresholds, for example red up to 40%, yellow from 40 to 70% and green above. Each user saves their own thresholds, and the setting applies everywhere: the dashboard, the grids, the comparison view and the exports. A client contact who treats 85% as the pass mark can set that without changing what the agency sees.
Filters
All views share one filter panel. Administrators pick the customer first; clients skip that step. Then: one or more waves, one or more questionnaires, zones, districts, locations, blocks, sections, questions and a date range. A filter applies to the view on screen and to the export of that view, so the file a client downloads matches what they were looking at.
Export
Any view exports as XLSX, PDF or HTML. The charts are rendered in the browser and converted on the server, so the PDF and HTML files carry the same charts as the screen, embedded as PNG images. The XLSX holds the numbers for further work in a spreadsheet. Every export is produced on demand from the current filter.
The client portal
What the client sees
A client account logs in through the same login screen as everyone else and lands in the portal. The navigation has three items: Shopper reports, Statistics and Help. Everything is read-only. The client cannot edit a report, change a score or see another customer's data. The restriction is enforced on the server at the controller level, not by hiding menu items.
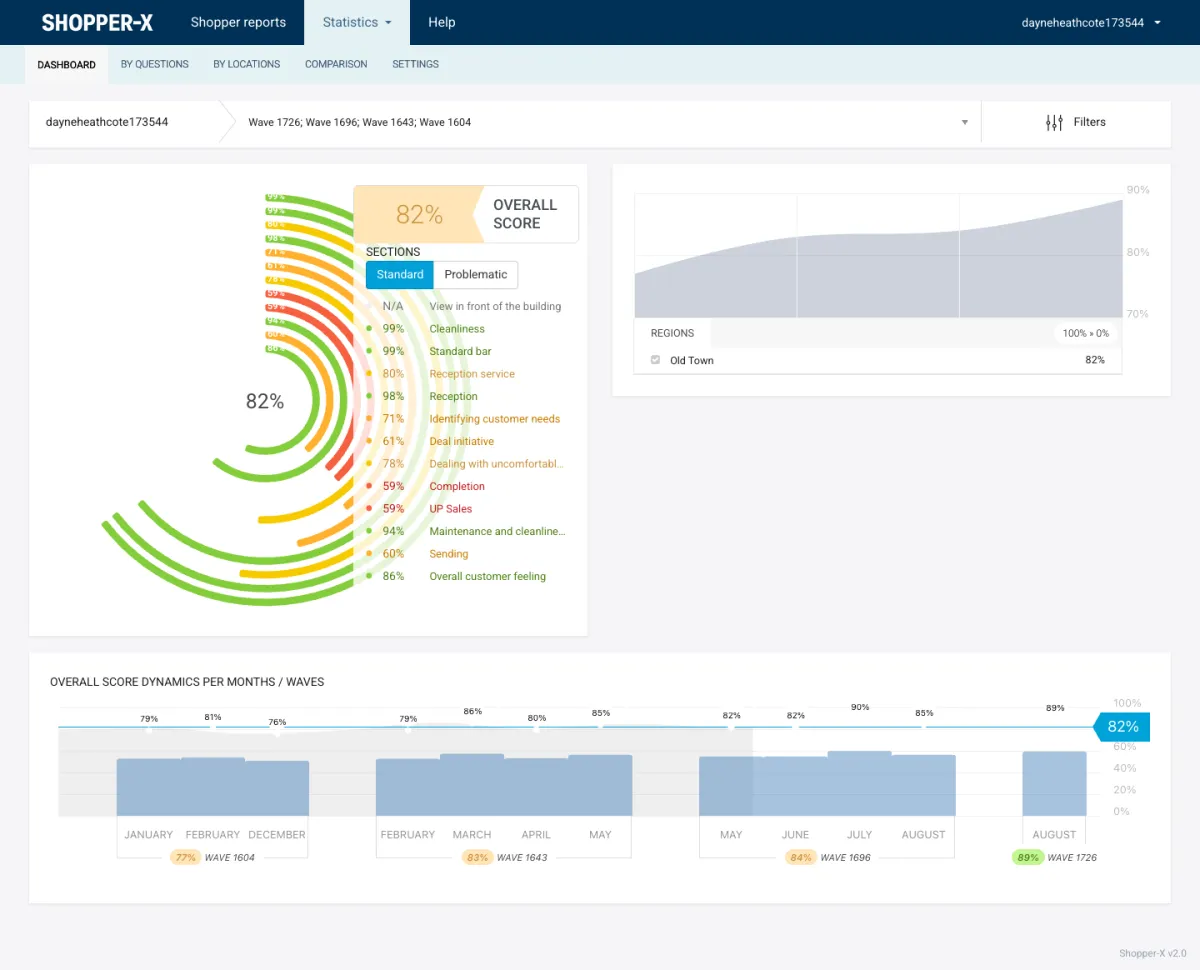
The screenshot is the client view of the same demo customer: the dashboard, limited to that customer's waves and locations.
Individual reports
The Shopper reports page lists one row per completed and validated visit. Filters: wave, questionnaire and date. Each row shows the location, date of check, outlet ID, city and address, with four actions: View only, Export to XLS, Export to PDF and Download all files. The last one fetches every photo and document the shopper attached to that visit.
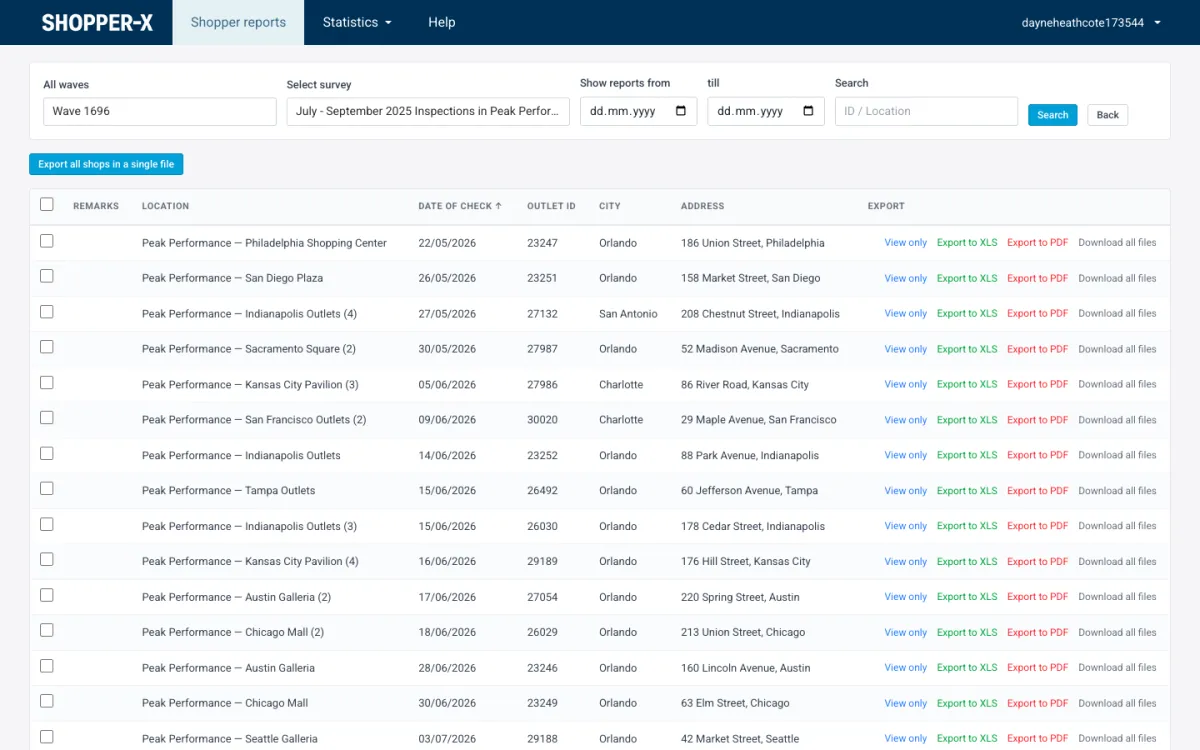
Select several rows to download them as one ZIP. The "Export all shops in a single file" button produces one Excel workbook with every report for the selected questionnaire.
Report builder
Clients and administrators can assemble their own report from pins. A pin is a saved chart or data view. Pins live in folders, are dragged into the report in any order, and can be split with separators. Chart images are optional per pin. The result is saved as a draft, as PDF, as Excel or as a web report. A web report gets a public link with an expiry date. The link can be switched off and on again, so a report shared for a quarterly review can be closed afterwards without deleting it.
Help with nine tutorials
The Help page inside the portal holds nine tutorial topics as embedded presentations: login, reports, statistics overview, block ratings, object ratings, comparison, filters, chart export and quick export. An agency onboarding a new client contact can point to these instead of writing its own guide.
Managers and restricted administrators
Two more roles sit between the full administrator and the client. A manager is internal staff attached to a wave. Managers see the schedule, the media library and the statistics, filtered to the waves they are assigned to, and receive notification emails with an optional Excel or PDF attachment. An administrator can be restricted to specific clients and to a subset of permissions through user groups, a checkbox tree where edit rights pull in the matching view rights. A regional account manager at the agency can see statistics for two brands and nothing else.
Pulling data into your own BI
For clients who run their own analysis, Shopper-X issues an API key per client. The key lists validated reports, returns a report's answers and fetches its attached files, so the data can be pulled into the client's own tools. Keys are stored hashed on the server.
Related features
- Mystery shopping software for agencies and brands: the whole platform in one page, from schedule to payments.
- Report validation: the review step that decides which reports reach the statistics and the client portal.
- Scheduling: the waves and audits that the reports and the dashboard columns are built on.
- Mystery shopping KPIs: which numbers to put on the dashboard and why.
FAQ
Does the client see unvalidated reports?
No. The individual reports page lists completed and validated visits only. A report that is still in review, returned to the shopper for corrections or marked unacceptable stays on the agency side.
Can I share a report with someone who has no login?
Yes. Save a report from the report builder as a web report. It gets a public link with an expiry date, and you can switch the link off and on at any time. Individual report exports (XLS, PDF, ZIP of files) are ordinary files you can send by any means.
Can color thresholds differ per user?
Yes. Thresholds are saved per user account and applied to every view and export for that user. The agency and each client contact can keep different bands.
Which export formats are available?
Statistics views: XLSX, PDF and HTML with the charts embedded as images. Individual reports: XLS and PDF per visit, a ZIP of the attached files, a ZIP of several selected visits, and one Excel workbook with all reports of a questionnaire. Administrators can also export a single report as HTML or JSON.
Want to see the dashboard with your own questionnaire and locations? Request a demo and we will set it up with your program.