
A mystery shopping program produces one number that everyone looks at: the overall score. It also produces a dozen numbers that few people look at, and some of them say more about the program than the score does. This post covers the mystery shopping KPIs worth tracking: how the score is built from question weights and sections, what a figure like 84% means and does not mean, which numbers measure the program itself, and how the shoppers are rated. The examples come from the Shopper-X demo, where a gym chain called Peak Performance runs quarterly waves.
How the overall score is built
Three layers sit under the headline number.
Question weight. Every scored question carries a weight. A points question has a maximum result and earns a share of its weight. A yes/no question earns the weight or nothing. Open-text questions carry no score. The questionnaire editor shows the running sum of weights, so the agency can see what share of the visit each section carries before the wave starts.
Section percentage. Questions are grouped into sections such as "Reception service" or "Standard bar". The section percentage is the weighted points awarded divided by the weighted points available in that section. Only scored questions count. A section that holds nothing but open text or a time of check shows N/A rather than a number.
Overall score. The same arithmetic over every scored question gives the overall score for one visit. For a wave, the same calculation runs over the reports of that questionnaire, and the dashboard draws it as a ring chart with one segment per section.
So what does 84% mean? Across the reports in the selected waves, the shoppers awarded 84% of the weighted points the questionnaire offered. It does not mean that 84% of visits went well or that 84% of staff followed the script. It is an index whose meaning depends on the weights, the sections and the pass mark agreed before the wave. Two programs with different questionnaires cannot be compared on it. The same program over several waves can, as long as the questionnaire has not changed in between; if it must change, clone it and start the trend again from that wave.
Section scores before the overall
Read the segments before the ring. The overall score hides movement inside it: one section can collapse while another rises and the total stays flat. The "By questions" view lays the sections out as rows with one column per wave; each section expands to its blocks and questions.
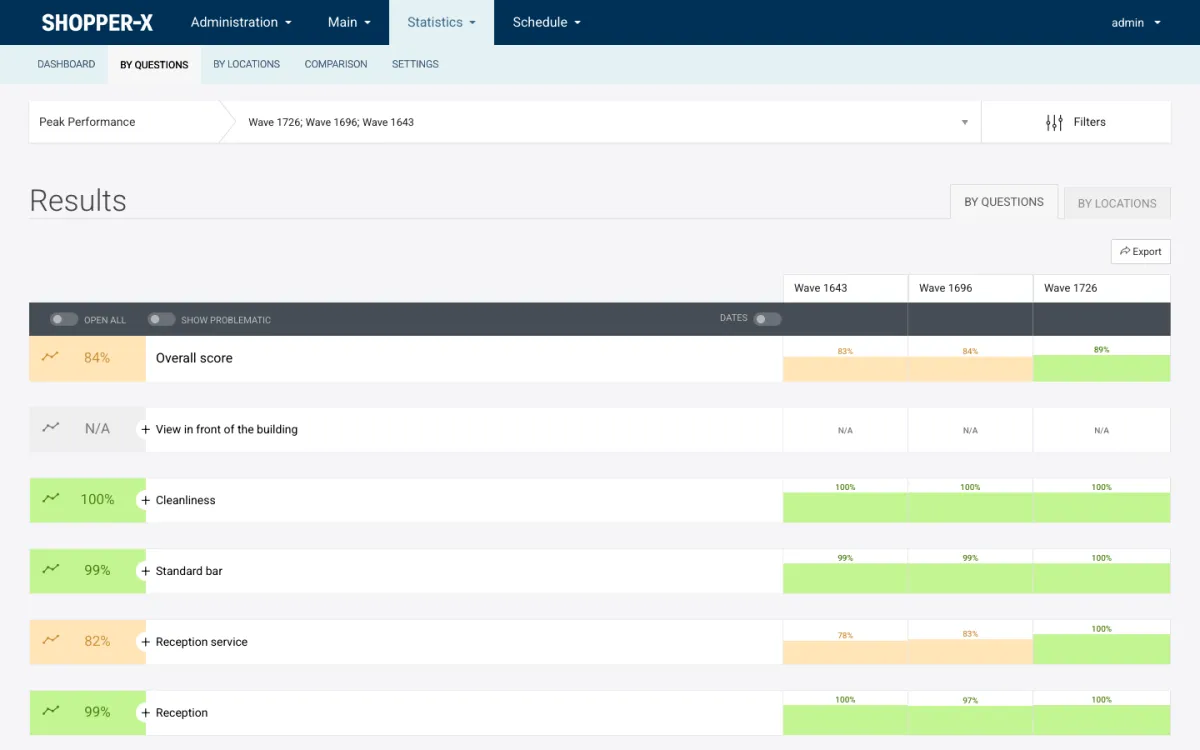
In the screenshot, Peak Performance scores 84% over three waves, at 83%, 84% and 89%. That looks like steady improvement. The rows tell the useful story. Cleanliness, Standard bar and Reception sit between 97% and 100% in every wave and are not where the money should go. Reception service moved from 78% to 83% to 100%, which is the change behind the rising total. "View in front of the building" shows N/A in every column because it holds only narrative answers and a time of check: evidence for the validator and the client, not a score.
A client who reads the ring first asks "why did we go up?" and gets a vague answer. A client who reads the rows first can say "reception service reached 100% in wave 1726" and open the questions under that row to confirm it.
Problem questions
The next layer down is the question, and the tool here is the "show problematic" toggle on the grid. Switched on, it hides every cell above the color threshold. For a questionnaire of 48 questions over three waves, the grid shrinks from 144 cells to the handful under the line.
A single red cell is a data point. A question that sits under the red line across three consecutive waves is a finding. It says the behavior is not one unlucky visit or one weak shopper. It is something the locations do not do, and training or a process change is needed rather than another wave of measurement. That sentence is what the client is paying for.
One caution: the grid shows the percentage without the sample size, and a cell built on two visits swings far more than one built on forty. Keep the visits per location in mind when reading it.
Comparing locations, districts and waves
The score becomes a management tool when it is set against something: another store, another district, or the same store three months ago. The comparison view puts objects, districts or zones side by side, one column each, with the color-coded overall score at the top and the percentage per section below. Columns are added and removed, and the selection persists through the session, so a regional manager who checks the same six gyms every month does not rebuild the set.
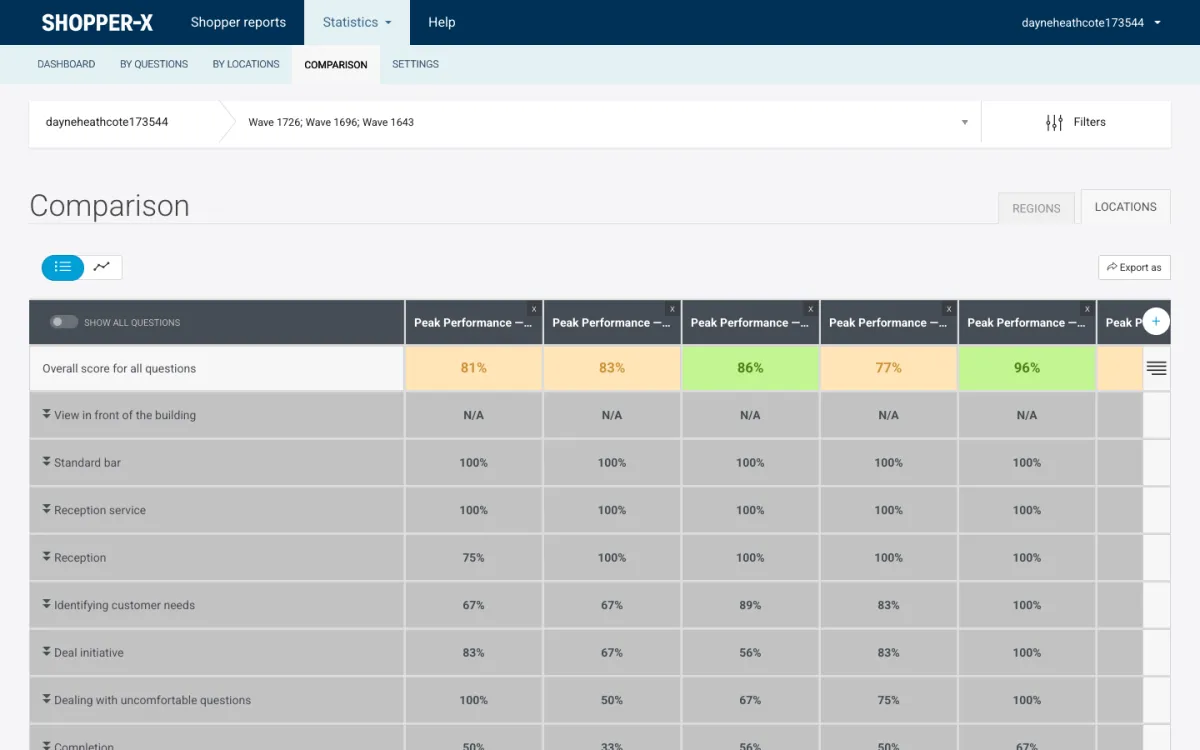
The screenshot is the client's own login, not the agency's. Five Peak Performance locations are compared over three waves, with overall scores of 81%, 83%, 86%, 77% and 96%. The rows show where the spread comes from: "Identifying customer needs" ranges from 67% to 100% and "Completion" from 33% to 67%, while "Standard bar" and "Reception service" are at 100% everywhere. The fourth location, at 77%, is not weak across the board. It loses its points in the four sales sections, from identifying needs to completion, where the fifth location scores 100% in three of them. That is a coaching conversation between two store managers, and the client can run it without the agency in the room.
For change over time, the dashboard's "overall score dynamics" bars show the score per month or per wave, and the grid gives the same trend per section.
Color thresholds
Every score is color-banded, and the bands are the pass marks. The example setting is red up to 40%, yellow from 40% to 70%, green above, but the thresholds are saved per user and apply everywhere that user looks: the ring chart, the grids, the comparison view and the exports. In the admin screenshot above, 84% renders yellow and 89% green, so the demo administrator has set a stricter band than the example.
Agree the bands with the client before the first wave and write them into the brief. Changing them mid-program damages the trend as much as changing the questionnaire does.
Mystery shopping KPIs for the agency program
The score measures the client's locations. The agency also needs numbers that measure the program: whether fieldwork and validation ran on time and clean. Shopper-X stores the inputs in the schedule and the report list but does not print them as a KPI card, so count them from the filtered lists or the schedule's XLSX export.
| KPI | Where the data comes from | What a bad value means |
|---|---|---|
| Share of reports validated on time | Report deadline per audit, validation end date per questionnaire, validated / not validated counts in the report list | The client is waiting on the agency, not on the shoppers |
| Reaction overdue count | Reaction status per audit (waiting, overdue, reacted); filter the schedule by it | Assigned shoppers are not accepting jobs; the pool is too thin for the wave |
| Returned-for-corrections rate | Audits that passed through the "returned" state, visible in the audit history and the status filter | Instructions are unclear, or the evidence rules at submit time are too loose |
| Unacceptable rate | Audits in the "unacceptable" state; the "unacceptable" tab in the report list | Shoppers are assigned to scenarios they are not qualified for |
| Audits per shopper per wave | The shopper column in the schedule, with the number of checks, and the approved-reports column in the shopper list | Too high and one shopper's judgment dominates a location's score; too low and recruitment is outrunning demand |
Track these per wave and per client. Most of them are generated in the validation workflow, where every return, remark and status change is logged.
KPIs for shoppers
A shopper is rated on each validated report, separately from the client's score. The validator grades four criteria during validation:
- Scenario: did the shopper follow the visit script?
- Report: are the answers complete and the comments clear?
- Evidence: are the required photos and receipts there and usable?
- Timeliness: were the visit and the submission inside the deadlines?
The default weights are 40, 30, 20 and 10, adjustable per questionnaire through a weight profile, so a photo-heavy retail audit can weigh evidence more than a phone-call scenario does. The average over a shopper's validated reports places them in a tier: Bronze below 70, Silver from 70 to 90, Gold at 90 and above. The tier shows as a badge next to the shopper's name, Gold shoppers are offered work first, and score feedback can be emailed to the shopper from a template.
The agency KPI here is the tier distribution of the active pool. If most of last wave's shoppers are Bronze, the score carries more noise than signal, and training courses (see shopper management) come before the next wave.
What not to measure
One number across unrelated scenarios. A client with a store visit, a phone enquiry and a website test has three questionnaires. Averaging them into one "customer experience score" gives a figure no manager can act on, because the three measure different staff doing different things. Report each scenario on its own.
Averages that include open-text questions. An open question has no maximum result. If it sits in the denominator, a section with five scored questions and three narrative ones reports a percentage that is far too low. Shopper-X keeps open text out of the arithmetic and shows N/A for a section without scored questions, which is why "View in front of the building" is blank above. If your current tool prints a number for a narrative-only section, check what it divides by. The post on questionnaire design walks through the weights with a worked example.
Unvalidated reports. Numbers built from raw submissions move later, when a validator returns or rejects a report. The client's reports page in Shopper-X lists only completed and validated visits, so read the wave after validation closes, not before.
FAQ
Is the overall score an average of the section scores?
No. It is calculated over every scored question with its weight, so a heavy section moves the overall score more than a light one. Sections at 90% and 70% do not give 80% unless their weights are equal.
Does the client see the shopper's rating?
No. The four criteria and the Bronze, Silver and Gold tiers are visible to administrators and validators. The client sees the validated report and the statistics built from it.
The score, the grids and the comparison view are described further on the reporting and client portal page, and the validator's side, including the shopper rating, on the report validation page. To see these grids with your own questionnaire and thresholds, request a demo and we will set them up with you.