
Retail mystery shopping has one job: tell a store manager what a customer saw in their store last Tuesday at 6 pm, in enough detail to fix it before the next quarter. This guide builds a retail program the way an agency project manager does it for a chain. The worked example is a phone-accessory chain with 72 stores in three regions, two visits per store per quarter, and a purchase under EUR 20 reimbursed to the shopper. The numbers are made up; the sequence is not.
What retail mystery shopping programs measure
A store visit lasts 10 to 20 minutes, and most retail questionnaires measure the same six things, in the order a customer meets them:
- Greeting: acknowledged, how soon, by whom (role, not name).
- Availability: the briefed item on the shelf, a staff member free within a reasonable time.
- Product knowledge: the scripted question answered ("Does this case work with wireless charging?").
- Add-on offer: a second item suggested without prompting (a screen protector with the case).
- Checkout: queue time, receipt offered, loyalty program mentioned.
- Store standards: window, lighting, price tags, display in place.
Keep one scenario per questionnaire: a purchase visit and a returns visit are two questionnaires, not one with branches. The example scenario: ask for a case for a two-year-old phone model, ask the knowledge question, buy the screen protector if it is offered and costs under EUR 20, leave. Writing the brief so every shopper plays the same customer is covered in the briefing guide.
The location hierarchy first
Before a question is written, the store list has to exist in the shape the client will read results in: customer, zone, district, city, object, where "object" is the individual store. For the example chain:
- Customer: the chain, with one client login scoped to its own data.
- Zone: optional; the chain uses it for store format (mall kiosk, street store, shop-in-shop).
- District: the three regions, North (30 stores), Center (24) and South (18).
- City: 41 cities, most with one store, the capital with nine.
- Object: 72 stores, named with the client's own store codes.
Build this from the client's store master, not by hand. In Shopper-X, locations are imported from XLSX or CSV with the district, city and zone columns. The regions panel, the by-locations view and the district comparison all read this hierarchy, so a store filed under the wrong district is wrong in every chart. Two common mistakes: importing stores without a district (the first wave then reports a single region) and using the city as the region, which falls apart at 41 cities.
Sections that follow the store
Order the questionnaire the way the visit happens, so the shopper fills it in from memory in the order they walked:
- Outside: window, opening-hours sign, lighting, entrance.
- Entry: greeting within a set time, staff visible.
- Floor: availability, product knowledge, add-on offer, demo units powered on, display in place.
- Checkout: wait time, receipt, loyalty mention, closing phrase.
- Exit: farewell, plus the one judgement question ("would you come back"), kept apart from the facts.
Weights decide what the score rewards. An example allocation: Outside 10, Entry 15, Floor 40, Checkout 25, Exit 10. Floor carries the weight because the chain's margin comes from add-on sales, and the add-on question alone takes 15 of the 40. Agree the weights with the client, write down why, and do not change them within a year or the trend chart stops meaning anything. Scoring mechanics are in the questionnaire design guide.
Photos matter more in retail than elsewhere because the findings are physical. Set the rule per question: one photo of the shelf position on the availability question, one of the new-model display on the display question, one of the receipt on the receipt question. The report cannot be submitted without them. Do not ask for general "photos of the store"; a validator cannot match those to a claim. The full rules are in the photo evidence post.
Scheduling a store estate
Seventy-two stores, two visits each, is 144 audits per wave. The decisions that matter in retail:
- Dayparts. Each audit carries a time range. The first visit of each pair is a weekday between 11:00 and 15:00; the second is a Saturday afternoon or a weekday evening, so no store is only ever seen on a quiet Tuesday morning.
- Excluded dates. The schedule settings per wave carry excluded dates. Put inventory days, a planned refit week, public holidays and the Black Friday week on the list.
- Custom fields. Add "store format" and "store code" as custom fields on the audit. Shoppers see them in the inbox and the schedule export appends them as columns.
- City coverage. Shoppers are matched to stores through their coverage area, the home city plus the areas they will travel to.
- Ads for thin cities. Perhaps 12 of the 41 cities have one store and two or three registered shoppers. Publish those audits as ads so any eligible shopper in reach can apply with a proposed date, then bulk-assign from the applications.
Two practical rules. Rotate shoppers so the same person does not do both visits of a store in a quarter; staff recognize faces. And set the reaction time (accept or reject within two days) and the fill-in time (report within 24 hours of the visit) per wave, so overdue reactions are visible in the schedule. More on the scheduling page.
Validation specifics for retail
Retail reports are checkable in ways a call-center report is not. Three checks the general validation checklist does not spell out:
- Receipt against the brief. The receipt photo should show that store, that date, a time inside the reported visit window, and an amount under EUR 20. A receipt for EUR 34 with a case on it means the shopper went off-script: the other fee is reimbursed up to the cap and the report goes back with a remark asking what was actually offered.
- Display photo against the planogram claim. "Was the new-model display in place as per the planogram?" is a yes/no question with a required photo. The validator opens the client's planogram (attached as the questionnaire's instruction file) and compares. A "yes" over a photo of last season's display becomes a "no" with a remark.
- Comment length on the service section. Give the product-knowledge and add-on questions a minimum comment length (200 characters is a workable floor) so that "staff was nice" cannot pass. The editor shows the character count and an "Enough symbols" check next to each answer.
Keep validation inside the wave, or the regional manager reads last quarter's stores in this quarter's meeting.
Reporting to regional managers
The person who acts on a retail score is a regional manager with 20 to 30 stores and a monthly operations meeting.
Attach a manager to the wave. Shopper-X has a manager role for internal staff: attached to a wave, the manager sees the schedule, media and statistics filtered to that wave and receives the notification emails with an Excel or PDF attachment.
Compare by district. The comparison view puts districts, or individual stores, side by side with the overall score per column and the section percentages underneath. A regional manager who sees North 86, Center 81, South 74, then opens South and finds the add-on question at 41% while greeting sits at 90%, has a meeting agenda rather than a number.
Agree the thresholds. Color bands (for example red up to 40%, yellow 40 to 70%, green above) are saved per user and applied to every chart and grid. Set them before the first wave so a red cell means the same thing in every meeting.
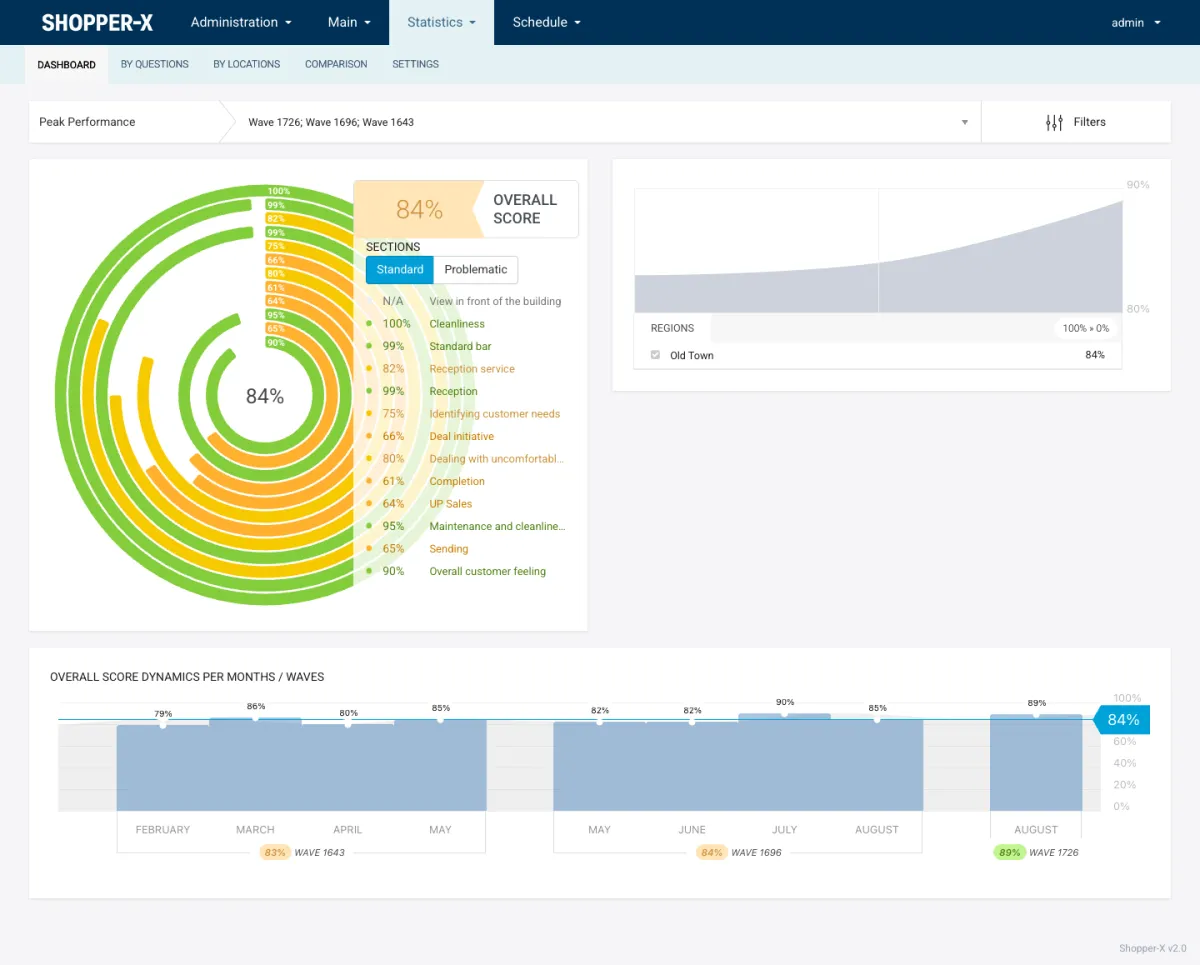
The dashboard above shows the overall score ring with the section breakdown, the regions panel with each district's score and trend, and score dynamics across waves. Any view exports as XLSX, PDF or HTML for the meeting pack. The rest is on the reporting page.
How many visits a store program needs
Two visits per store per quarter is a compromise. At 144 visits per wave the regional numbers are solid: North has 60 observations per question, Center 48, South 36. The store number is not: two visits give a store 0%, 50% or 100% on a yes/no question, and a store manager can fairly say the shopper caught a bad day. Over the year a store accumulates eight visits, which is where a repeated failure on one question becomes a pattern worth a coaching conversation. Per-store conclusions inside one quarter need three or four visits per store, or an extra monthly visit to the ten weakest stores. The arithmetic is in the sample size post.
From score to store visit
A score of 74 for the South region does nothing by itself. The reading order is: overall, then sections (Floor at 58%), then the question (add-on offer at 41%), then the individual reports of the three worst stores, where the comment reads "the assistant found the case, rang it up and said nothing else". That sentence, plus the display photo, is what the regional manager brings to the store. How to run that conversation is in how to use mystery shopping results.
FAQ
Should shoppers buy something?
Yes, if the scenario reaches the checkout; the receipt is the proof the visit happened at the reported time. Keep the amount small and capped, reimburse it as the "other fee" on the audit next to the shopper's pay, and say in the brief what to do when the item costs more than the cap (do not buy, report the price). A client who does not want 144 small purchases a quarter stops the scenario before checkout and takes a storefront photo instead.
Can store managers see their own store only?
The client login sees every store of the chain. For a store manager, export the individual report to PDF per visit, or build a report for that store in the report builder and issue a public web link with an expiry date.
How are store formats compared?
The comparison view works on stores, districts and zones. To compare kiosks with street stores, record the format as the zone and compare zones. If the zone already carries geography, tag each audit with a store-format custom field and compare in the schedule export.
Related reading
- Reporting: dashboards, comparison and client reports
- Photo evidence rules for mystery shopping: what to require and check
- Mystery shopping sample size: how many visits per location, how often
To plan a retail wave for your own chain, request a demo and bring your store count and regions.