
Most programs are good at producing a score and poor at doing anything with it. The wave closes, the client gets a PDF with 84% on the cover, and the next wave produces another PDF. This article is about what happens after validation: what to benchmark against, how to read the results, how to turn one finding into a coaching conversation, and how to check next wave whether anything changed.
One fictional store runs through the article. Store 14 in Region North scored 84% overall in the autumn wave. Across its ten visits, the question "greeting within 30 seconds" failed in seven. One shopper attached a photo of the side entrance blocked by a pallet of stock.
The score is not the finding
84% says nothing about what to do on Monday. A score is built from dozens of weighted questions, so a strong section hides a weak one (how the weights add up is covered in mystery shopping KPIs and what the score means). The overall score is where the reading starts, not where it ends.
The finding is always narrower than the score: one question, in one place, in one wave. "Greeting within 30 seconds failed in 7 of 10 visits to Store 14 in the autumn wave" is a finding; a manager can stand on the floor at 17:30 and watch for it. "Service section at 61%" is still a summary. Before any result goes out, ask whether someone could change something tomorrow because of it. If not, go one level deeper.
Benchmark against the right thing: by location, by region, by wave
A result means something only next to a reference, and three references answer three different questions.
- The store's own history. Store 14 was 79% two waves ago and 83% last wave, so 84% is a slow climb. But the greeting question failed in 5 of 10 visits last wave and 7 of 10 now: worse, while the total got better.
- Its region. Region North averages 86%. If the whole region fails the greeting question, the problem is not Store 14.
- The network. All 72 locations average 81%. The head office cares about this number; the store manager cannot use it.
A comparison view that puts locations side by side with their overall and section scores is the tool for a mystery shopping benchmark by location. In Shopper-X the client adds and removes columns in the comparison, so a regional manager compares the eight stores in her region and nobody else's, and the selection stays while she moves between views. The same screen compares regions or zones.
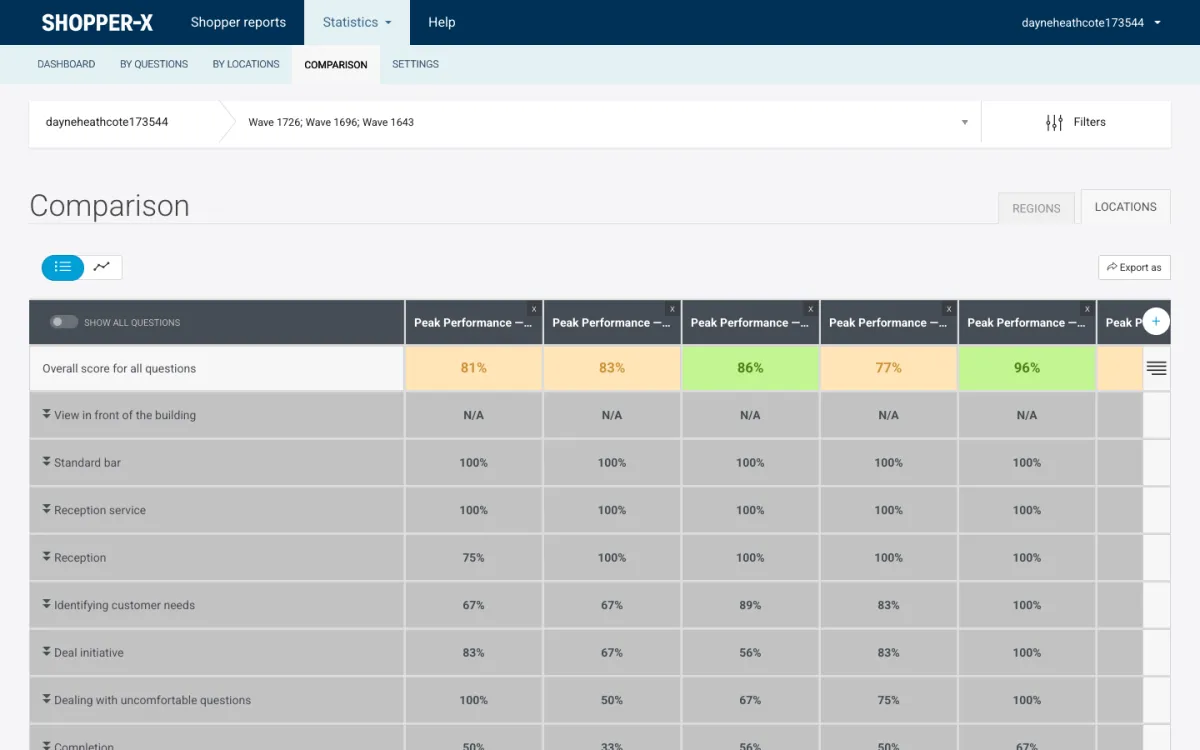
Agree the color thresholds with the client before the first wave, not afterward. A common setting is red up to 40%, yellow from 40 to 70% and green above 70%; a program with a 90% network average will want green to start higher. The thresholds are saved per user and applied across the statistics views, so the regional meeting and the head office report show the same colors.
One caution: a store with two visits and 50% has one failed visit, not a trend. The post on mystery shopping sample size covers how many visits a comparison needs before the ranking means anything.
How to use mystery shopping results: the reading order
Reading results in the wrong order is how a meeting ends up arguing about one photo before anyone has looked at the section scores. Keep a fixed order.
- Overall score and trend. One number, its movement over the last three waves, its place in the region. Do not open anything else yet.
- Sections. Which section pulled the score down. For Store 14: Greeting and approach at 61%, everything else above 88%.
- Problem questions. Inside the weak section, which questions failed, in how many visits, and whether they failed in other stores too. A "show problematic" filter that hides every question above the threshold cuts a 48-question grid to the four that matter.
- The individual report. Only now open the visits: the shopper's narrative for the failed question, the visit time, the photos. The seven failed greetings in Store 14 all happened between 17:00 and 19:00. That is a staffing fact, not an attitude fact, and the grid would never show it.
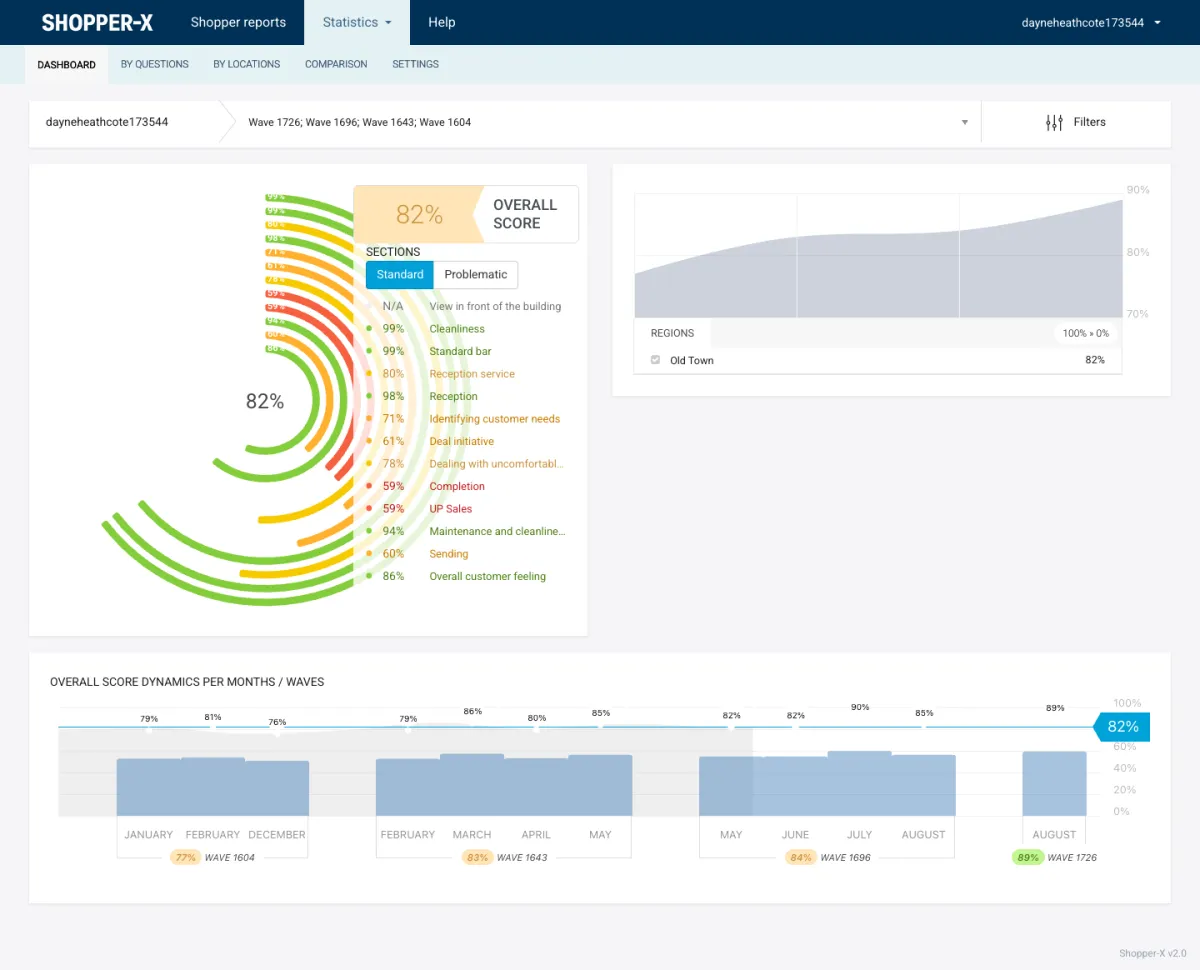
The client dashboard is built for the first step: the overall score as a ring chart with the sections around it, a region panel with the trend, and the score dynamics across waves. The grids by questions and by locations serve steps two and three; the individual reports page, with narrative and attached files per visit, is step four.
Process failures and people failures
Before writing anything to a store manager, sort the findings into two piles, because the piles have different owners.
| Finding | Type | Owner | The fix looks like |
|---|---|---|---|
| Out of stock on a promoted line | Process | Supply chain, category manager | Order rules, delivery schedule |
| Planogram not followed | Process | Merchandising, regional manager | Fixture check, delivery of material |
| Side entrance blocked by stock | Process, local cause | Store manager, delivery schedule | Move the delivery slot |
| No greeting within 30 seconds | People | Store manager | Shift plan at peak hours, coaching |
Process failures go up the chain. A store manager cannot fix a planogram that arrived wrong from head office, and writing to him about it only produces a defensive reply. People failures go to the store manager and stay there.
The blocked entrance shows why the photo matters. Without it the finding is "entrance accessible: no", which the manager will dispute. With a photo of a pallet at 17:40 on a Tuesday, the conversation is about the delivery slot (see mystery shopping photo evidence).
The one-page coaching note
What a store manager receives should fit on one page: three facts, one photo, one ask, a date. This is the note for Store 14.
Store 14, Region North. Autumn wave, 10 visits, 84% overall (region 86%).
1. Greeting within 30 seconds: 3 of 10 visits passed. Last wave 5 of 10. All seven failures were between 17:00 and 19:00.
2. Product knowledge, checkout and exterior all scored 88% or above. Checkout was the best in the region.
3. On one visit (Tuesday, 17:40) the side entrance was blocked by a stock pallet. Photo attached.
Ask: a floor-coverage plan for the 17:00 to 19:00 slot, and the delivery moved outside opening hours. We go through it on October 24. The next wave starts November 10.
Lead with the fact that is both the weakest and the most fixable. Include a positive fact so the note reads as a report, not a reprimand. Phrase the ask as something the manager controls. And write from the data, not from memory: if the grid says 3 of 10, the note says 3 of 10.
Give managers access instead of PDFs
A PDF ages the moment it is sent; a manager who gets one in October will still quote it in January. With access to the live results the manager always sees the validated version and his own history.
Scoping is what makes this safe. In Shopper-X a client login is read-only and sees only that client's own data. Inside the agency, a manager role is attached to a wave and sees only the schedule, media and statistics for the waves assigned to it.
For meetings, the report builder covers the case where a shared link beats a login. The client pins the views she needs (the comparison of her eight stores, the greeting question across waves), arranges them into a report, and issues a public web link with an expiry date. The link stops working after the meeting week. The reporting and client portal page lists what the client role can see.
Close the loop next wave
A coaching conversation without a measurement after it is just a conversation. The next wave has to ask the same question at the same location with the same scoring, or before and after cannot be compared. Do not reword the greeting question "to make it clearer" between waves; a reworded question is a new question with no history.
Then read the dynamics per wave: the overall score across the last three or four waves, and the one question you asked the manager to fix. One possible outcome for Store 14: 3 of 10, then 7 of 10, then 9 of 10. That is a closed loop. 3, 4, 3 is also an answer, and it means the next conversation is with the regional manager, not the store.
Retire what is solved. A question that is green in every store for three waves in a row no longer measures anything; it costs shopper time and dilutes the score. Replace it with the next thing the client wants to know, and announce the change so the score drop does not read as a decline.
What not to do
- Do not rank stores on one visit. A single visit measures one shopper, one shift and one hour. The next visit will reshuffle the ranking, and the managers at the bottom will rightly refuse to take it seriously.
- Do not pay bonuses on one wave. Once a score moves money, the easiest questions get gamed, and a store with two lucky visits wins. If results must feed incentives, use a rolling average over several waves, exclude stores with too few visits, and announce the rule in advance.
- Do not share shopper identities. Not the name, not "the woman with the red bag on Tuesday". The store will recognize the shopper next time and the program is over for that location. Stripping identifying details from the narrative is part of validation; the report validation checklist has the full list.
FAQ
Should store managers see the full report?
The narrative and the photos for their own store, usually yes; that is what makes a finding credible. Hide anything that identifies the shopper, including the exact visit time in a small store. Whether a manager sees the neighboring stores is a client decision; many programs show only the regional average.
How often should results be discussed?
Once per wave with each store manager, within two weeks of validation closing and before the next wave starts. Monthly waves need a shorter format: the one-page note alone, with a call only where the note raises a question.
The score is where the reading starts; the finding is one question in one store in one wave, with a photo and a date attached.
Related reading
- Mystery shopping KPIs: what to measure and what the score means
- Mystery shopping sample size: how many visits a comparison needs
- Reporting and the client portal in Shopper-X
To set this up with your own locations and thresholds, contact us and we will prepare a wave for you.